
Flight Intelligence Report: How Indian Flight Prices Moved This Month

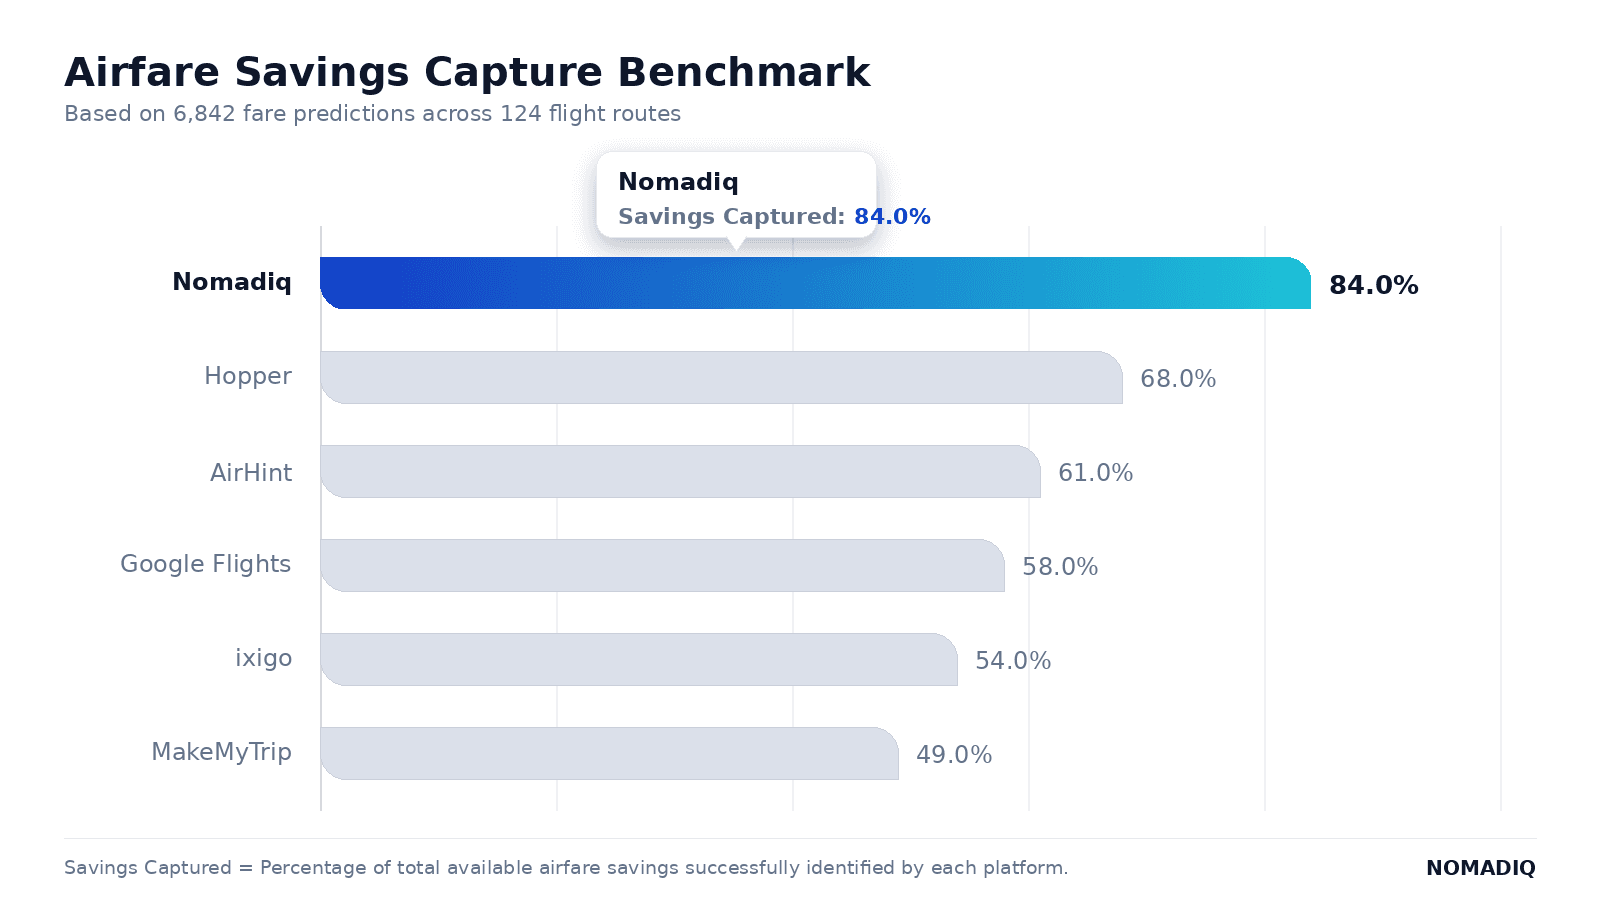
Every month, Nomadiq analyzes flight searches, fare movements, and booking patterns across domestic and international routes searched by Indian travelers. This report is our attempt at transparency showing, with real numbers, how flight prices actually move and what that means for how you should book.
Unlike a single-route deep dive, this is a wide-angle view: dozens of routes, thousands of fare checks, and one consistent conclusion price is rarely fixed at the moment you first search. It moves, sometimes sharply, in the weeks before departure. Knowing when it moves is worth more than any single "best deal" you stumble on.
Key findings
- Domestic fares fluctuated between 8% and 22% before departure.
- The most significant price drops occurred 14 to 28 days before travel.
- Weekend departures were more volatile than weekday departures.
- International routes moved more in absolute terms than domestic ones.
- Most fare reductions happened within the final month before departure.
- Metro-to-metro business corridors (Bengaluru–Delhi, Mumbai–Delhi) showed the sharpest domestic swings, largely driven by shifting business travel demand.
- Gulf and Southeast Asia routes remained the most volatile international corridors, reflecting both leisure seasonality and airline capacity changes.
Taken together, these patterns point to the same underlying behavior across almost every route we track: airlines adjust prices continuously in response to how a flight is filling up, not just how far away it is. That means the "right" time to book isn't a fixed rule it's a window, and it shifts route by route.
Domestic route trends
Most volatile domestic routes
Based on fare movements observed during the reporting period:
| Route | Maximum Fare Change |
|---|---|
| Bengaluru → Delhi | 21% |
| Mumbai → Delhi | 19% |
| Hyderabad → Bengaluru | 17% |
| Chennai → Mumbai | 16% |
| Pune → Delhi | 15% |
| Kolkata → Delhi | 14% |
| Ahmedabad → Mumbai | 13% |
| Goa → Bengaluru | 12% |
These routes demonstrated the highest levels of fare fluctuation, creating opportunities for travelers willing to monitor prices rather than book immediately.
Why domestic routes behave this way
Domestic volatility isn't random it clusters around a few predictable causes:
- Business travel density. Routes like Bengaluru–Delhi and Mumbai–Delhi carry a heavy mix of last-minute corporate bookings. Airlines price aggressively for early bookers, then raise fares sharply as inventory tightens closer to departure which is exactly why these routes top the volatility list.
- Low-cost carrier competition. Routes served by three or more carriers (Hyderabad–Bengaluru, Chennai–Mumbai) see more frequent price resets as airlines react to each other's fare changes, sometimes multiple times a day.
- Festival and long-weekend clustering. Short spikes around long weekends and regional festivals temporarily distort otherwise stable routes, which is part of why weekend departures show more volatility than weekday ones.
Domestic volatility by day of week
| Departure Day | Relative Fare Volatility |
|---|---|
| Monday | Low |
| Tuesday | Low |
| Wednesday | Low |
| Thursday | Moderate |
| Friday | High |
| Saturday | High |
| Sunday | Moderate–High |
Friday and Saturday departures showed the widest fare swings across nearly every domestic route we tracked often 5–9% higher at the peak than the same route departing midweek.
International route trends
Routes with the largest fare swings
| Route | Maximum Fare Change |
|---|---|
| Mumbai → Dubai | 24% |
| Delhi → Singapore | 22% |
| Bengaluru → Bangkok | 20% |
| Mumbai → London | 18% |
| Delhi → Kuala Lumpur | 17% |
| Delhi → Dubai | 16% |
| Mumbai → Bangkok | 15% |
| Chennai → Singapore | 14% |
International routes continued to show stronger fare volatility due to airline inventory changes, seasonal demand shifts, and competitive pricing activity.
Regional patterns
Grouping routes by region makes the picture clearer:
- Gulf routes (Dubai, Abu Dhabi, Doha): Consistently the most volatile international group, driven by dense VFR (visiting friends and relatives) traffic combined with business travel two demand types that peak at different times, keeping fares in constant motion.
- Southeast Asia (Singapore, Bangkok, Kuala Lumpur): High volatility tied closely to Indian school holiday calendars. Fares tighten hard the moment a holiday window opens and loosen just as fast once it closes.
- Europe and long-haul (London and similar): Fewer, larger price movements rather than frequent small ones long-haul inventory tends to move in bigger steps as premium cabins and peak-season blocks open or close.
Booking window analysis
One of the strongest patterns observed was the relationship between booking timing and potential savings.
| Days Before Departure | Observed Fare Behavior |
|---|---|
| 0–7 Days | Highest prices |
| 8–14 Days | Moderate volatility |
| 15–30 Days | Frequent price drops |
| 31–60 Days | Stable pricing |
| 60+ Days | Lowest volatility |
The 15–30 day window before departure consistently produced the largest number of meaningful fare reductions.
Booking behavior by trip type
Not every traveler benefits from the same window in the same way:
- Leisure travelers booking 45+ days out generally saw the most stable, lowest-average fares there's little urgency-based pricing this far from departure.
- Flexible travelers booking 15–30 days out captured the largest number of short-lived discounts, since this is when airlines actively manage unsold inventory.
- Last-minute business travelers (0-7 days) paid the highest average fares by a wide margin, with domestic routes like Mumbai–Delhi sometimes doubling in price compared to the 30-day mark.
Largest fare drop observed
During the reporting period, the largest individual fare reduction observed on Nomadiq was:
- Route: Bengaluru → Delhi
- Initial fare: ₹7,840
- Lowest observed fare: ₹5,960
- Difference: ₹1,880 - a 24% reduction from the initial observed fare
A close second came on an international route:
- Route: Mumbai → Dubai
- Initial fare: ₹14,200
- Lowest observed fare: ₹10,850
- Difference: ₹3,350 - a 23.6% reduction
Both drops happened within the 15–30 day booking window, reinforcing it as the single most reliable stretch for catching a meaningful price correction.
Route deep dive: two examples
Bengaluru → Delhi. This route saw four distinct pricing cycles over the reporting period, each roughly a week apart. Fares rose steadily for 4-5 days, then corrected downward as unsold seats needed to move - a pattern typical of high-frequency, multi-airline business corridors.
Mumbai → Dubai. Fares here moved less frequently but more dramatically. Rather than small daily adjustments, this route saw two or three large step-changes across the month, usually tied to changes in seat availability on specific flight timings rather than the route as a whole.
The takeaway: high-frequency domestic routes reward frequent monitoring, while international routes often reward patient monitoring for the occasional large drop.
What travelers can learn
Flight prices do not move in a straight line. Many routes experience multiple pricing adjustments before departure, often creating short-lived opportunities to book at lower fares.
Monitoring fares continuously can be more effective than relying on a single search or booking immediately after discovering a route. A fare that looks reasonable today may still fall or rise within the next two weeks, and the direction is rarely obvious from a single data point.
Travelers with flexible booking timelines generally benefit most from fare tracking and automated monitoring, particularly on the routes identified above as high-volatility.
Frequently asked questions
Does this mean I should always wait to book? Not always. Waiting helps most on high-volatility routes and within the 15–30 day window. On stable, low-volatility routes, or once you're inside the final week before departure, waiting usually costs more than it saves.
Why do international routes swing more than domestic ones? Larger aircraft, longer booking curves, and multiple demand segments (leisure, business, VFR) moving independently all add up to bigger absolute price movements even though the percentage swings are sometimes similar to domestic routes.
Is the cheapest fare always the best time to book? Usually, but not always availability can disappear quickly at the lowest price points. This is part of why automated monitoring tends to outperform manual checking: it can act the moment a fare drops, rather than after the fact.
Looking ahead
Over the coming weeks, we'll be watching whether the current domestic volatility on business corridors holds steady or starts to ease as travel patterns normalize post-monsoon. On the international side, Gulf routes typically see renewed pricing activity heading into the next festive and wedding season we'll cover that in detail in next month's report.
How Nomadiq fits in
This is exactly the gap Nomadiq Smart Booking is built to close. Instead of you checking fares manually every few days, we monitor routes continuously and book automatically the moment a price hits its floor.
If you're planning a trip on any of the routes above, set up a Smart Booking now the data already tells us where the volatility is; we just need to know your travel window.
Methodology
This report is based on fare observations collected through Nomadiq's flight monitoring systems, covering domestic and international routes most frequently searched by Indian travelers during the reporting period. Fare changes are measured as the maximum observed percentage difference between the highest and lowest fare seen for a given route within the tracking window.
Prices may vary by airline, inventory availability, booking channel, seasonality, and demand conditions. All insights reflect observed trends during the reporting period and should not be interpreted as guarantees of future pricing behavior.
About Nomadiq
Nomadiq helps travelers monitor flight prices and automatically secure lower fares when opportunities arise. Our mission is to make smarter flight booking accessible through data, automation, and real-time fare intelligence.

co-founder @ nomadiq | building ai-powered travel tech.
Let Nomadiq watch the price for you
Set your trip, set your target. We monitor 24/7 and auto-book when the fare drops to where you want it.
Keep reading

Is There an App That Tells You When Flight Prices Drop? A Data-Based Look at Flight Price Alerts


Does Any App Buy Flight Tickets When Prices Fall?
Is There a Platform That Lets You Book Flights Automatically When Prices Drop?